World Class Provider Of Foreign Exchange Trading Services
Point and Figure Patterns
Trend Reversal Patterns
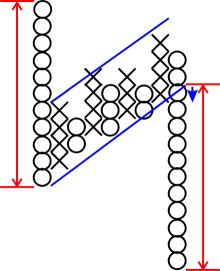
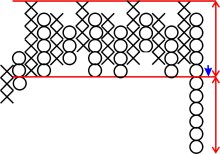
Head and Shoulders
The head and shoulders pattern is found in candlestick, point and figure, and chart patterns and is considered one of the most reliable reversal patterns.
The price forms a high on column one, followed by a period of consolidation. A second high is created followed by another period of consolidation, the right shoulder is then formed followed by a sell off. High volume should be seen on the last downward move.
Parralel support and resistance lines can be drawn as well as a visible neckline.
The height of the highest high should give a projection of the drop of the final downward move.
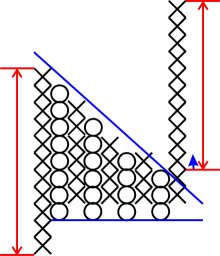
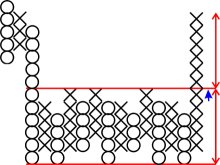
Inverted Head and Shoulders Pattern
The inverted head and shoulders pattern is found in candlestick, point and figure, and chart patterns and is considered one of the most reliable reversal patterns.
The price forms a low on column one, followed by a period of consolidation. A second low is created followed by another period of consolidation, the right shoulder is then formed followed by a buy signal as it crosses the neckline.
Parralel support and resistance lines can be drawn as well as a visible neckline.
The height of the lowest low should give a projection of the strength of the upward move.
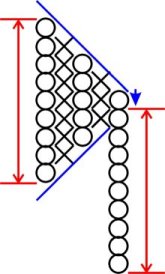
Triple Top
The triple top is a variation of the head and shoulders pattern. This pattern consists of three peaks of similar height. After the third peak is formed and the price movement breaks the neckline, a bearish signal is given. The expected drop should be of similar height as from the neckline to the tops.
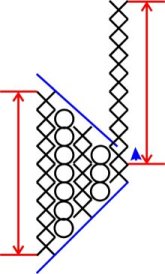
Triple Bottom
The triple bottom is a variation of the inverted head and shoulders pattern. This pattern consists of three lows of similar height. After the third low is formed and the price movement breaks the neckline, a bullish signal is given. The expected rise should be of similar height as from the neckline to the low.
Double Top
The double top is a variation of the triple top pattern. This pattern consists of two peaks of similar height. After the second peak is formed and the price movement breaks the neckline, a bearish signal is given. The expected drop should be of similar height as from the neckline to the tops. It is important to note that before the price drop, the trend line is broken.
Double Bottom
The double bottom is a variation of the triple bottom pattern. This pattern consists of two lows of similar height. After the second low is formed and the price movement breaks the neckline, a bullish signal is given. The expected rise should be of similar height as from the neckline to the tops. It is important to note that before the breakout, the trend line is broken.
Bearish Rectangle Reversal
The uptrend forms a clear period of consolidation, the support line is then broken on a heavy volume day, it is at this point where the bearish signal occurs.
Bullish Rectangle Reversal
The downtrend forms a clear period of consolidation, the resistance line is then broken on a heavy volume day, it is at this point where the bullish signal occurs.
No warranties are given by Traders Exchange Corp. and no warranties are implied regarding the content of the suggested reading material or the content of the website(s) which can be accessed through this website. Traders Exchange Corp. shall not be liable in any way for losses or liability of any kind to any person resulting directly or indirectly through the use in any way by such person of the information referred to and/or use of the suggested reading material or the website(s), however such loss or liability occurs, and whether financial or otherwise. The pages and the opinions or information contained in the suggested reading material or these website(s) are the creation of outside parties and do not necessarily reflect the opinions or representations of Traders Exchange Corp.